Taxonomy of Network Analysis Indicators

Macro, Meso, and Node-Level Measures

SMM638 Network Analytics

Three Levels of Analysis

Network indicators operate at different scales:

Level Focus Questions
Macro Entire network How big? How centralized? How connected?
Meso Groups/Communities Are there clusters of nodes? How modular?
Micro/Node Individual positions Who is central? Who bridges groups?

Caution

Key Principle: Different levels reveal different insights

  • Macro: Overall structure and properties
  • Meso: Subgroup organization
  • Micro: Individual advantages and constraints

Macro-Level Indicators

Whole Network Properties

Characterize the overall structure and global patterns

Key Measures:

  1. Network Size: Number of nodes and edges
  2. Density: Proportion of possible connections realized
  3. Centralization: Concentration of connections
  4. Diameter: Maximum distance between any two nodes
  5. Average Path Length: Mean distance across all pairs
  6. Fragmentation: Presence of disconnected components

Purpose: Understand network-wide characteristics and compare across networks

Example: Network Size and Density

Definition: Basic structural properties

  • Node count: Total number of vertices (\(n\))
  • Edge count: Total number of connections (\(m\))
  • Possible edges: \(\frac{n(n-1)}{2}\) for undirected networks

Business Example: LinkedIn Network

  • Small startup network (50 employees)
    • Possible connections: 1,225
    • Observed connections: 245
    • Density: 20%
  • Large corporation network (5,000 employees)
    • Possible connections: 12,497,500
    • Observed connections: 187,500
    • Density: 1.5%

Insight: Larger networks typically have lower density

Network Metrics:

Nodes (n) 5
Edges (m) 6
Possible Edges 10
Density 60.0%

Example: Centralization

Definition: Extent to which connections concentrate around few nodes

  • High centralization: Star-like, hierarchical structure
  • Low centralization: Distributed, egalitarian structure

Business Example: Communication Patterns

Startup (Low Centralization = 0.25)

  • Flat structure with distributed communication
  • Multiple people coordinate projects
  • Information flows through many channels

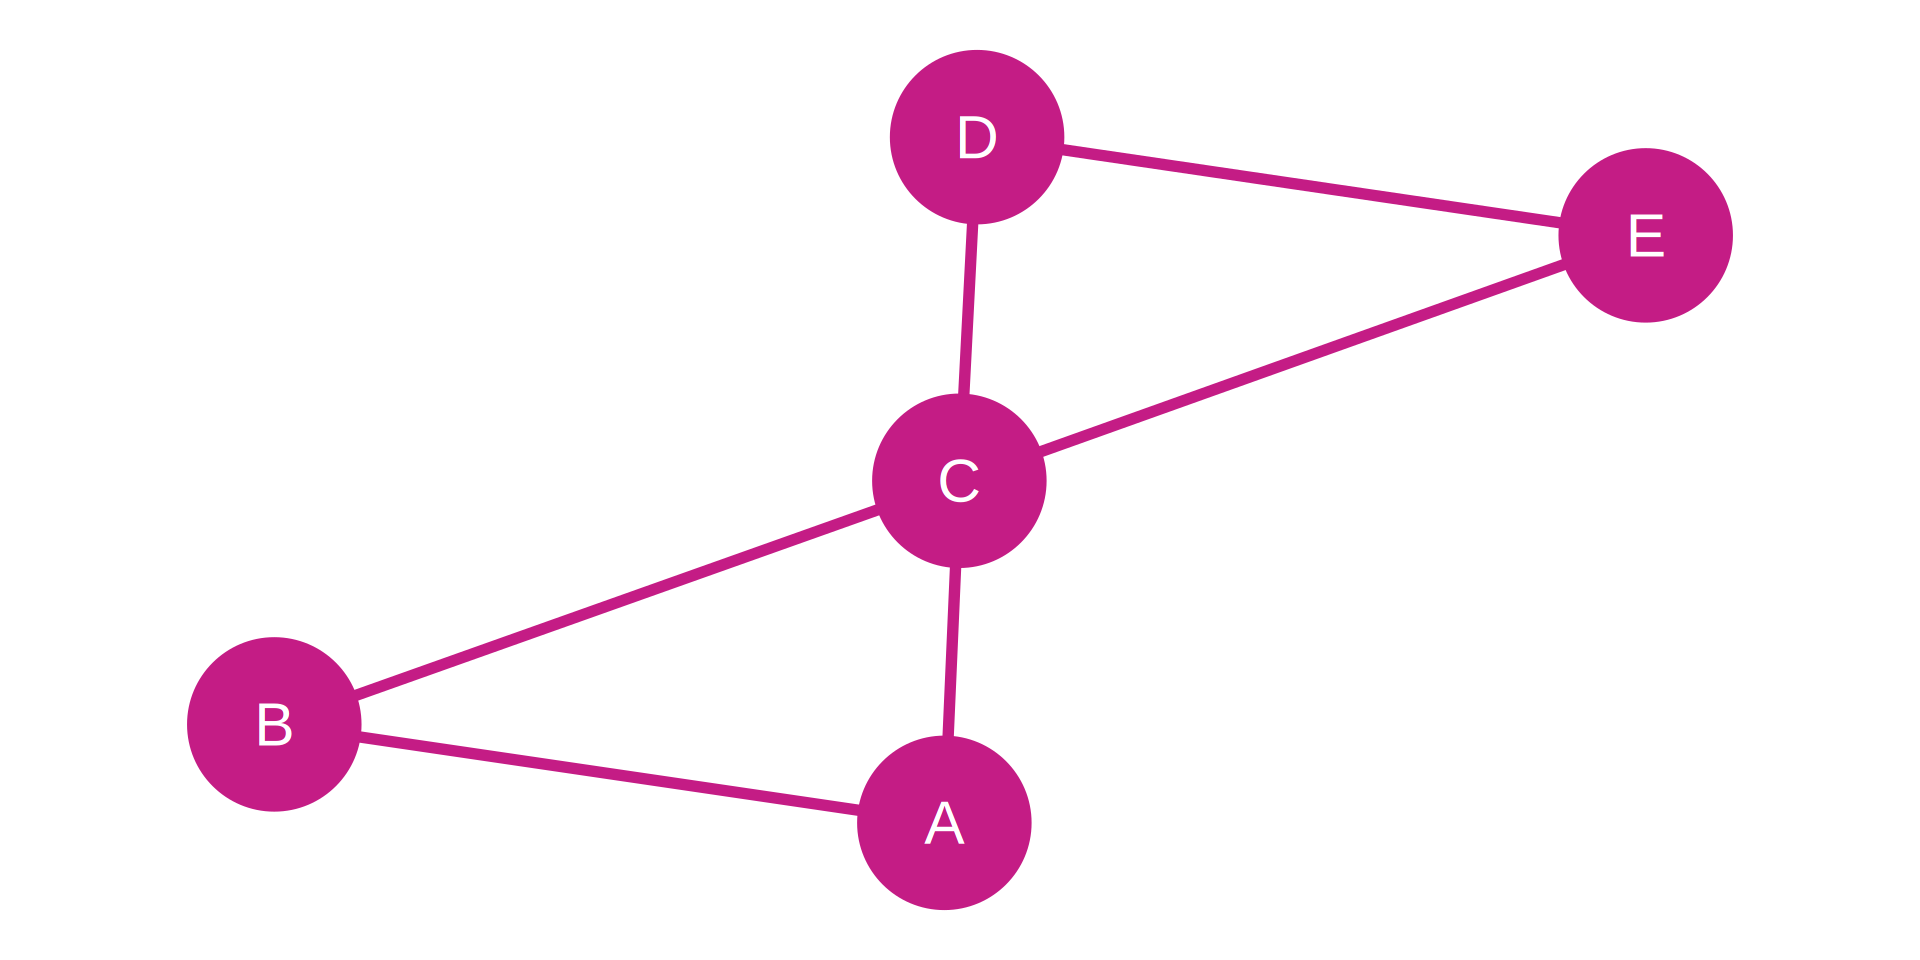
Traditional Corporation (High Centralization = 0.78)

  • Hub-and-spoke: most communication through managers
  • Clear hierarchy and formal reporting
  • Information bottlenecks at central nodes

Implication: Centralization affects agility, innovation, and resilience
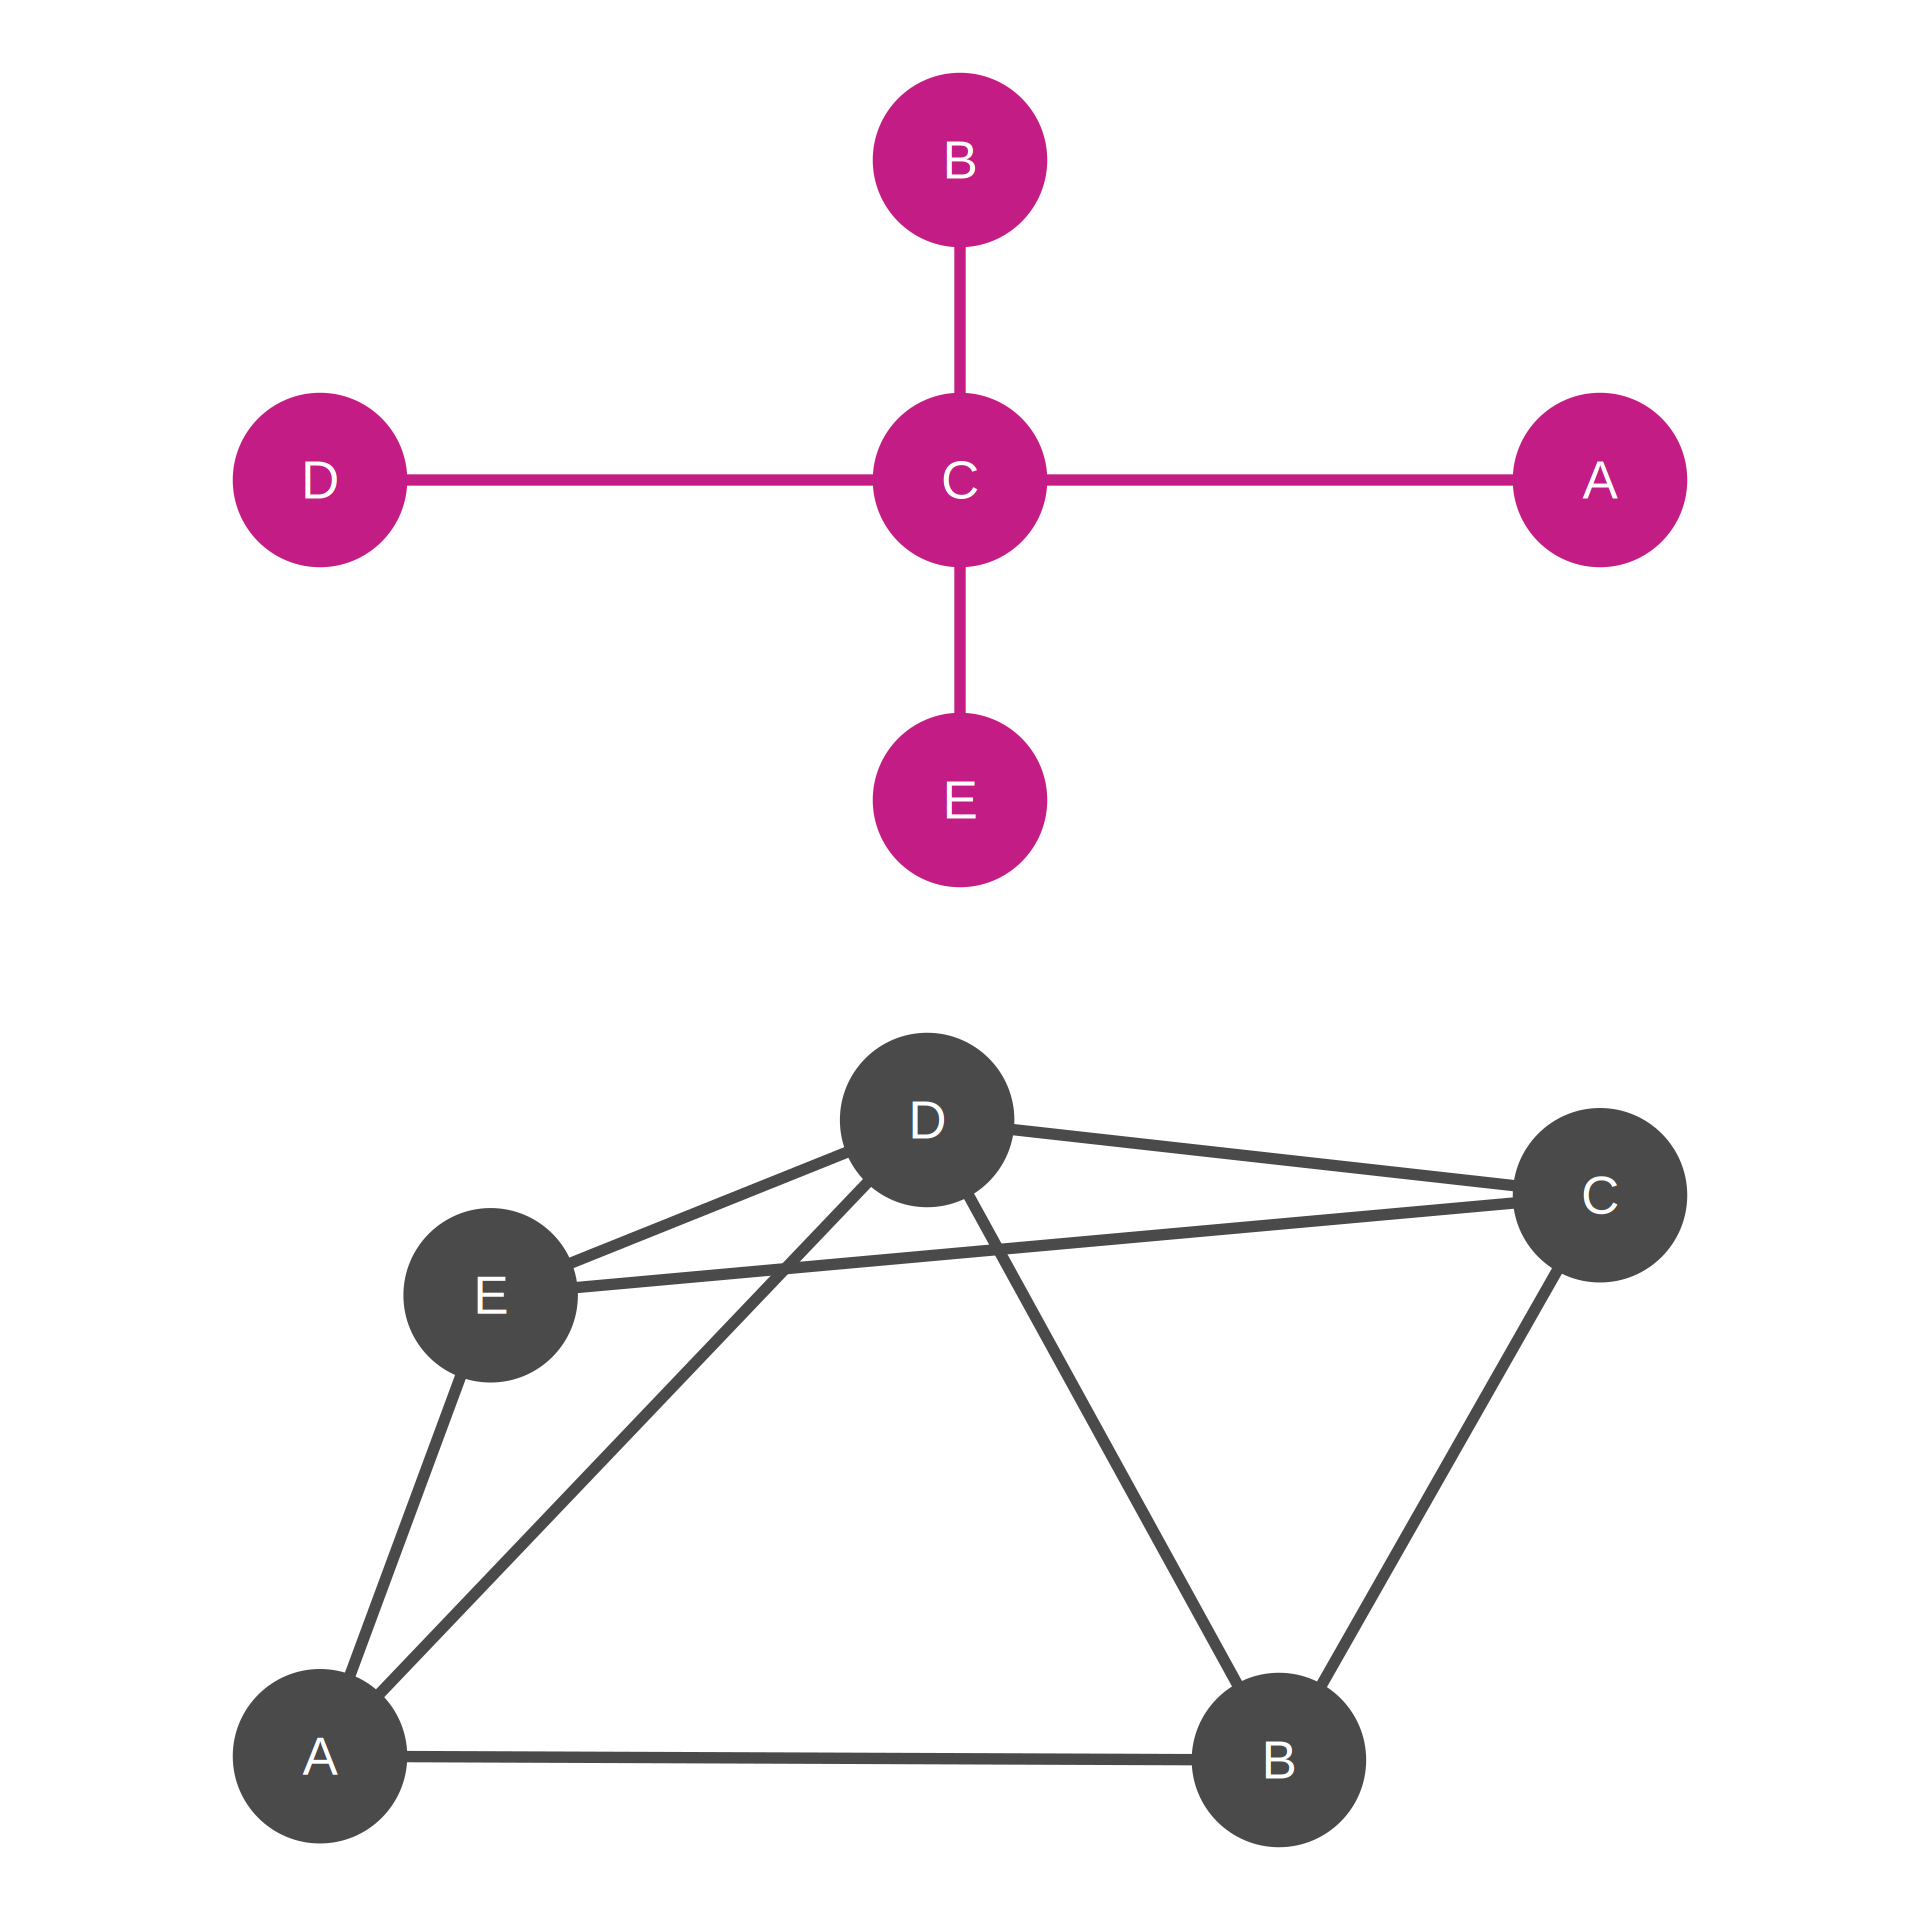
Network Metrics:

Network Size Density
Higher centralization (top) 5 nodes, 4 edges 40.0%
Lower centralization (bottom) 5 nodes, 8 edges 80.0%

Meso-Level Indicators

Community and Subgroup Structure

Identify cohesive groups and organizational patterns

Key Measures:

  1. Modularity: Quality of network partitioning into groups
  2. Community Detection: Algorithmic identification of clusters
  3. Core-Periphery: Distinction between dense core and sparse periphery
  4. Structural Holes: Gaps between groups creating brokerage opportunities
  5. k-cores: Subgraphs where all nodes have minimum degree k

Purpose: Reveal hidden organizational structure and group boundaries

Example: Network Modularity

Definition: Strength of division into communities

  • Measures how well network separates into distinct groups
  • Higher values indicate stronger community structure

Business Example: Corporate R&D Network

Higher Modularity

  • Clear separation: Chemistry, Biology, Engineering teams
  • Limited cross-disciplinary collaboration
  • Potential for siloed innovation

Lower Modularity

  • Extensive cross-team connections
  • Interdisciplinary collaboration
  • Potential for breakthrough innovation but coordination challenges

Strategic Implication: Community structure reflects organizational integration vs. specialization trade-offs
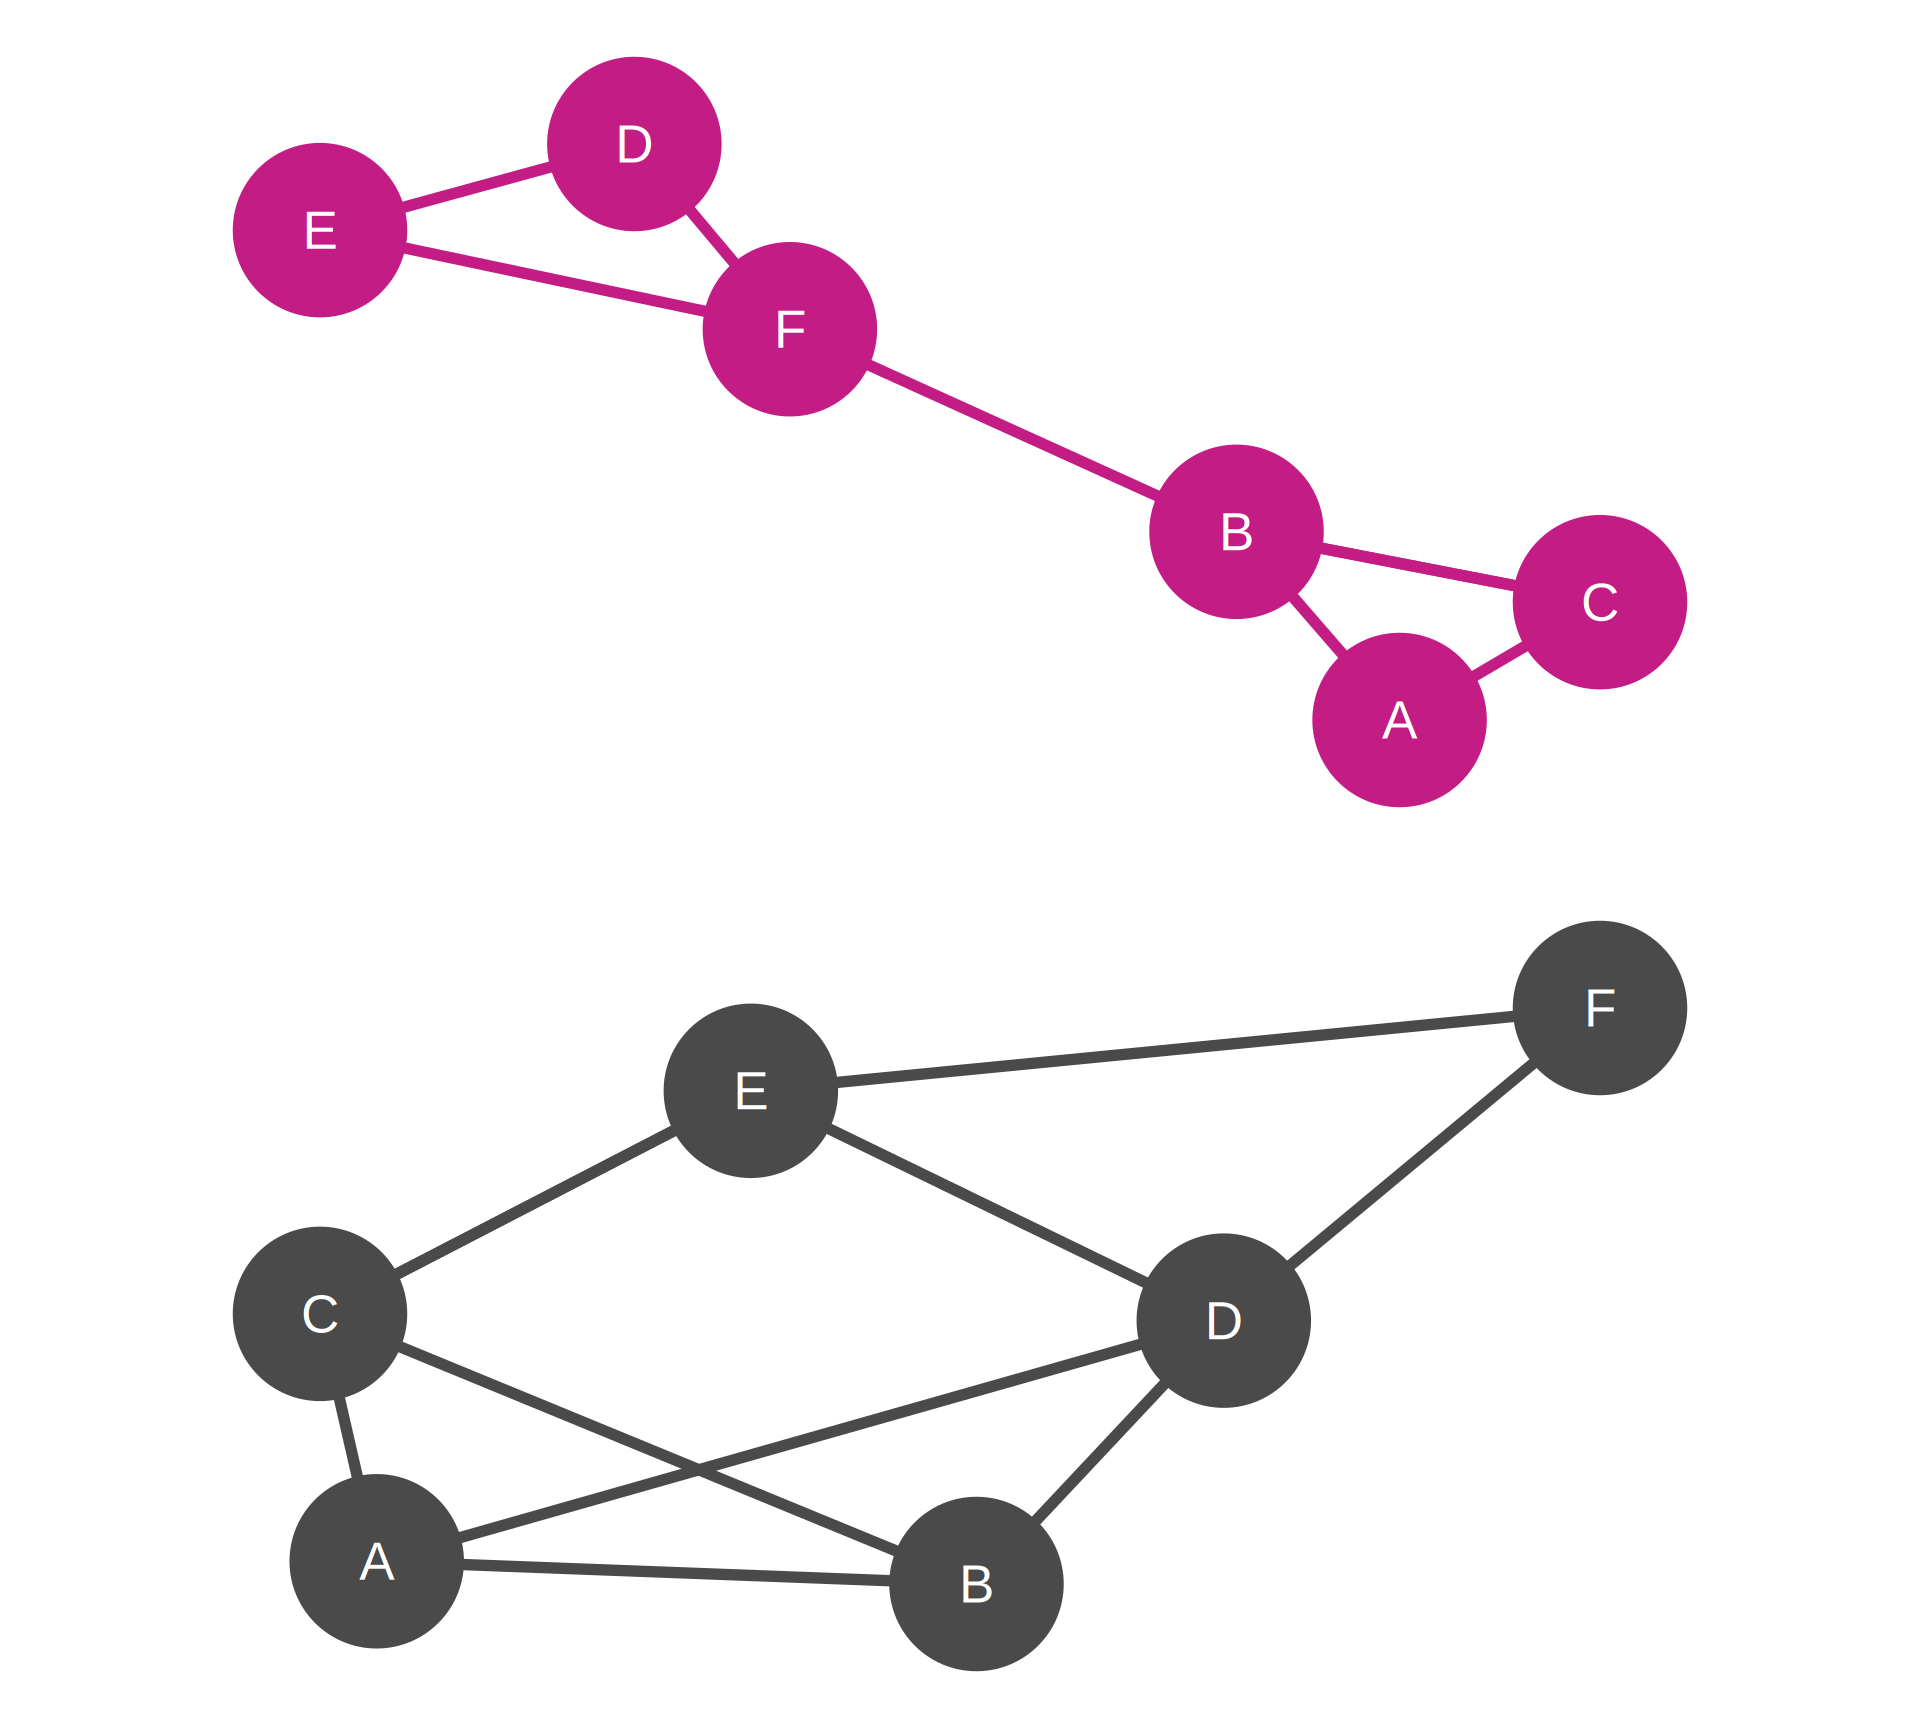
Note

The top network seems to have two communities ({A, B, C} and {D, E, F} triads)

The bottom network does not show any obvious community structure

We will explore modularity indicators and community detection algorithms in detail in Weeks 7 and 8.

Node-Level Indicators

Individual Position and Influence

Characterize actor positions within the network

Major Categories:

  1. Centrality Measures: Various ways to measure importance

    • Degree, Closeness, Betweenness, Eigenvector
  2. Structural Position: Role in network architecture

    • Bridges, Brokers, Isolates, Cliques
  3. Local Clustering: Cohesion of immediate neighborhood

  4. Embeddedness: Integration into network structure

Purpose: Identify influential actors, structural advantages, and vulnerabilities

Note

Much more to follow on node-level indicators today

Summary: Levels in Practice

Integrated Analysis Framework:

Macro Level → Strategic organizational design

  • Should we have a centralized or distributed structure?
  • How connected is our organization overall?

Meso Level → Team and department dynamics

  • Are we too siloed or too integrated?
  • Where are the boundaries between groups?

Micro Level → Individual talent management

  • Who are our key connectors and influencers?
  • Who has structural advantages or disadvantages?

Important

Best Practice: Analyze networks at multiple levels simultaneously for comprehensive insights