import networkx as nx
import matplotlib.pyplot as plt
import numpy as np
# Color palette: black, magenta, gray
BLACK = '#000000'
MAGENTA = '#c41c85'
GRAY = '#999999'
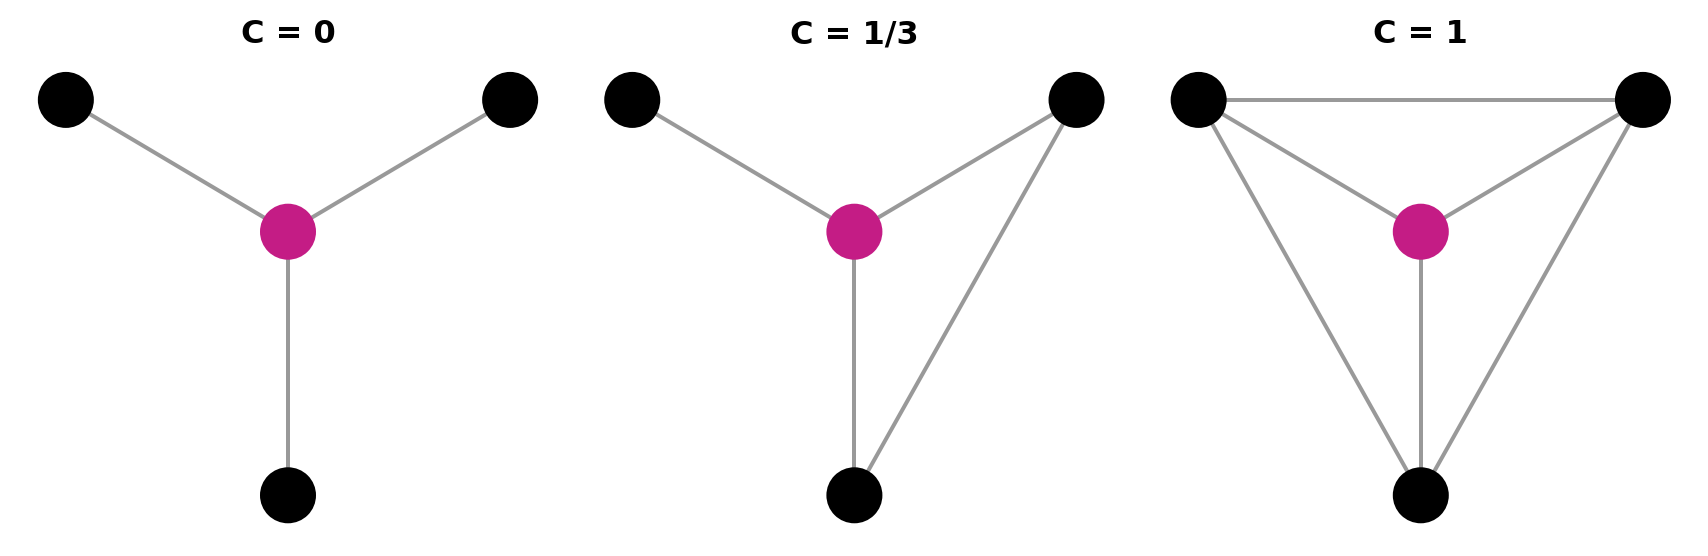
# Three examples of clustering
# C = 0: star graph, no edges between neighbors
G1 = nx.Graph()
G1.add_edges_from([(0,1), (0,2), (0,3)])
colors1 = [MAGENTA, BLACK, BLACK, BLACK]
# C = 1/3: one edge between neighbors
G2 = nx.Graph()
G2.add_edges_from([(0,1), (0,2), (0,3), (1,2)])
colors2 = [MAGENTA, BLACK, BLACK, BLACK]
# C = 1: all neighbors connected
G3 = nx.Graph()
G3.add_edges_from([(0,1), (0,2), (0,3), (1,2), (2,3), (1,3)])
colors3 = [MAGENTA, BLACK, BLACK, BLACK]
fig, axes = plt.subplots(1, 3, figsize=(9, 3))
# Star layout with center at origin
def star_layout(G):
pos = {0: (0, 0)}
neighbors = list(G.neighbors(0))
for i, n in enumerate(neighbors):
angle = 2 * np.pi * i / len(neighbors) - np.pi/2
pos[n] = (0.8 * np.cos(angle), 0.8 * np.sin(angle))
return pos
for ax, G, colors, title in [(axes[0], G1, colors1, 'C = 0'),
(axes[1], G2, colors2, 'C = 1/3'),
(axes[2], G3, colors3, 'C = 1')]:
pos = star_layout(G)
nx.draw_networkx_edges(G, pos, edge_color=GRAY, width=1.5, ax=ax)
nx.draw_networkx_nodes(G, pos, node_color=colors, node_size=400, ax=ax)
ax.set_title(title, fontweight='bold', color=BLACK)
ax.axis('off')
plt.tight_layout()
plt.show()