In this script, we retrieve and manipulate the vectors associated with a set of target words. Then, we manipulate the retrieved vectors to appreciate the semantic similarity among the target words.
We start by loading the libraries necessary for the script and pre-trained word vectors (achieved by applying word2vec over the Google News Corpus).
Python
Copy
>>> import numpy as np # for data manipulation
>>> from scipy.spatial.distance import cosine # to calculate cosine distance
>>> import matplotlib.pyplot as plt # for data visualization
>>> import gensim.downloader as api. # the pre-trained vectors
We use Gensim’s API to load the word vectors.
Python
Copy
>>> wv = api.load("word2vec-google-news-300")
Here is the list of target words, a set of contemporary pop singers.
Python
Copy
>>> artists = [
"taylor_swift",
"beyonce",
"alicia_keys",
"katy_perry",
"mariah_carey",
]
We retrieve the word vectors as we iterate over the elements of the list ‘artists’.
Python
Copy
>>> vectors = [] # the container
>>> for artist in artists:
try: # exception handling
artis_vector = wv[artist]
vectors.append(artis_vector)
except:
print("Vector not available for {}".format(artist))
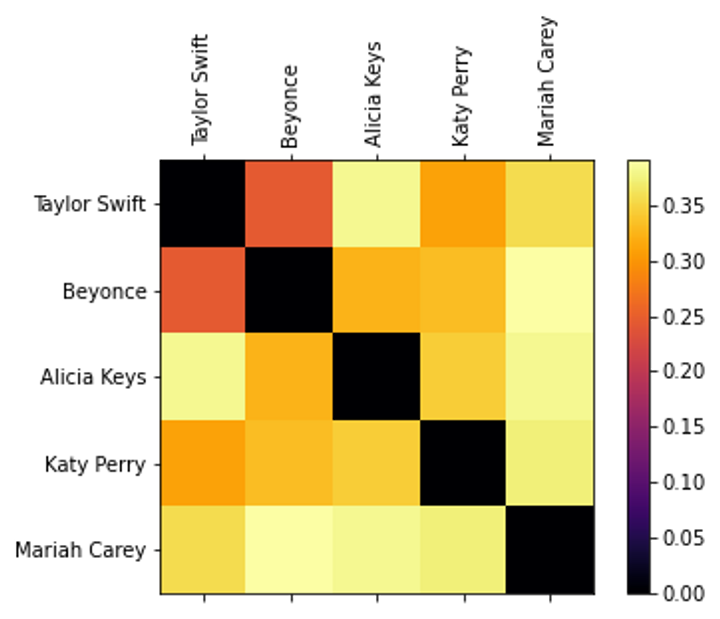
Using sciPy’s cosine function, included in the ‘distance’ module, we create a square matrix containing the semantic similarity scores for any pair of target words (including the elements in the matrix’s diagonals).
Python
Copy
>>> cs = np.empty(np.repeat(len(artists), 2)) # the container
>>> for i in range(len(artists)):
for j in range(len(artists)):
cs[i, j] = cosine(vectors[i], vectors[j])
Finally, we use a heat-map to visualize the semantic similarity scores. Note that larger values denote closer (i.e., less distant) vectors.
Python
Copy
>>> ax = fig.add_subplot(111)
>>> caxes = ax.matshow(cs, interpolation="nearest", cmap="inferno")
>>> fig.colorbar(caxes)
>>> ax.set_xticks(np.arange(0, len(artists), 1))
>>> ax.set_yticks(np.arange(0, len(artists), 1))
>>> labels = []
>>> for artist in artists:
split = artist.split("_")
split = [s.title() for s in split]
labels.append(" ".join(split))
>>> ax.set_xticklabels(labels, rotation="vertical")
>>> ax.set_yticklabels(labels)
>>> plt.show()
This snippet comes from the Python script “similarity.py”, hosted in the GitHub repo simoneSantoni/NLP-orgs-markets.