library(igraph)
library(ggraph)
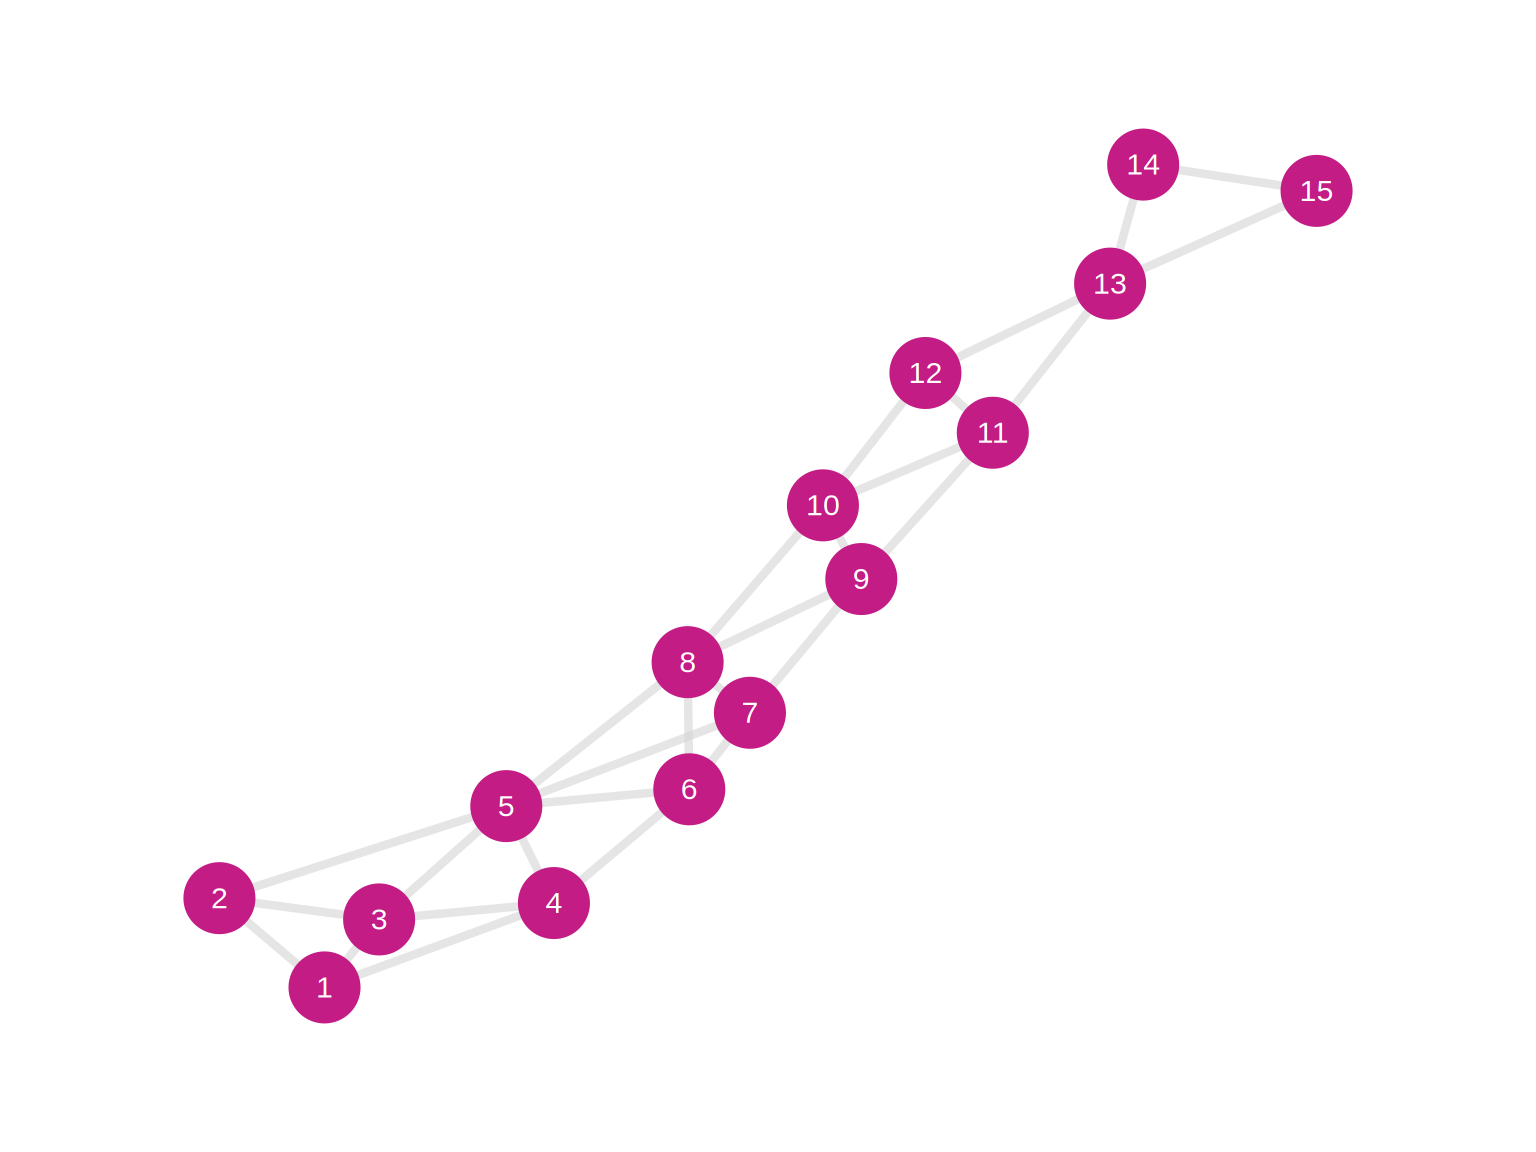
# Create a larger exercise network (15 nodes)
set.seed(999)
edges_exercise <- data.frame(
from = c(1, 1, 1, 2, 2, 3, 3, 4, 4, 5, 5, 5, 6, 6, 7, 7, 8, 8, 9, 9, 10, 10, 11, 11, 12, 13, 13, 14),
to = c(2, 3, 4, 3, 5, 4, 5, 5, 6, 6, 7, 8, 7, 8, 8, 9, 9, 10, 10, 11, 11, 12, 12, 13, 13, 14, 15, 15)
)
g_exercise <- graph_from_data_frame(edges_exercise, directed = FALSE)
# Plot the network
ggraph(g_exercise, layout = 'fr') +
geom_edge_link(color = "#D3D3D3", width = 1.5, alpha = 0.6) +
geom_node_point(color = "#c41c85", size = 12) +
geom_node_text(aes(label = name), color = "white", size = 4) +
scale_x_continuous(expand = expansion(mult = 0.2)) +
scale_y_continuous(expand = expansion(mult = 0.2)) +
theme_void() +
theme(
plot.background = element_rect(fill = "white", color = NA)
)